

Visitor stats
Pageviews, visitors and traffic sources for the last 30 days
The Analytics page shows how many people visit your store, which pages get attention, and where visitors come from. You'll find the page in the dashboard sidebar under Analytics.
Why Umami instead of Google Analytics?
We use Umami as the analytics engine. It gives you the same essentials Google Analytics does — pageviews, visitors, top pages, traffic sources, countries and devices — but with a key difference for your store:
- No cookie banner. Umami uses no cookies and collects no personal data, so your store doesn't need to show a cookie-consent dialog just to track visits.
- GDPR-compliant by default. Nothing identifying is stored, so compliance comes for free.
- Lighter on the page. The tracking script is small and doesn't slow your store down.
So you get everything you need for day-to-day monitoring without forcing visitors to click "Accept cookies" before they can browse products.
Connecting analytics
The first time you open the page, you'll see a Connect analytics button. Connecting is a single click — a tracking ID is created in Umami behind the scenes, with no external account or installation required.
Tracking starts immediately
Stats begin accumulating right after you connect. The first few hours may look empty — give it a day to gather data before drawing any conclusions.
What the page shows
Every section defaults to the last 30 days.
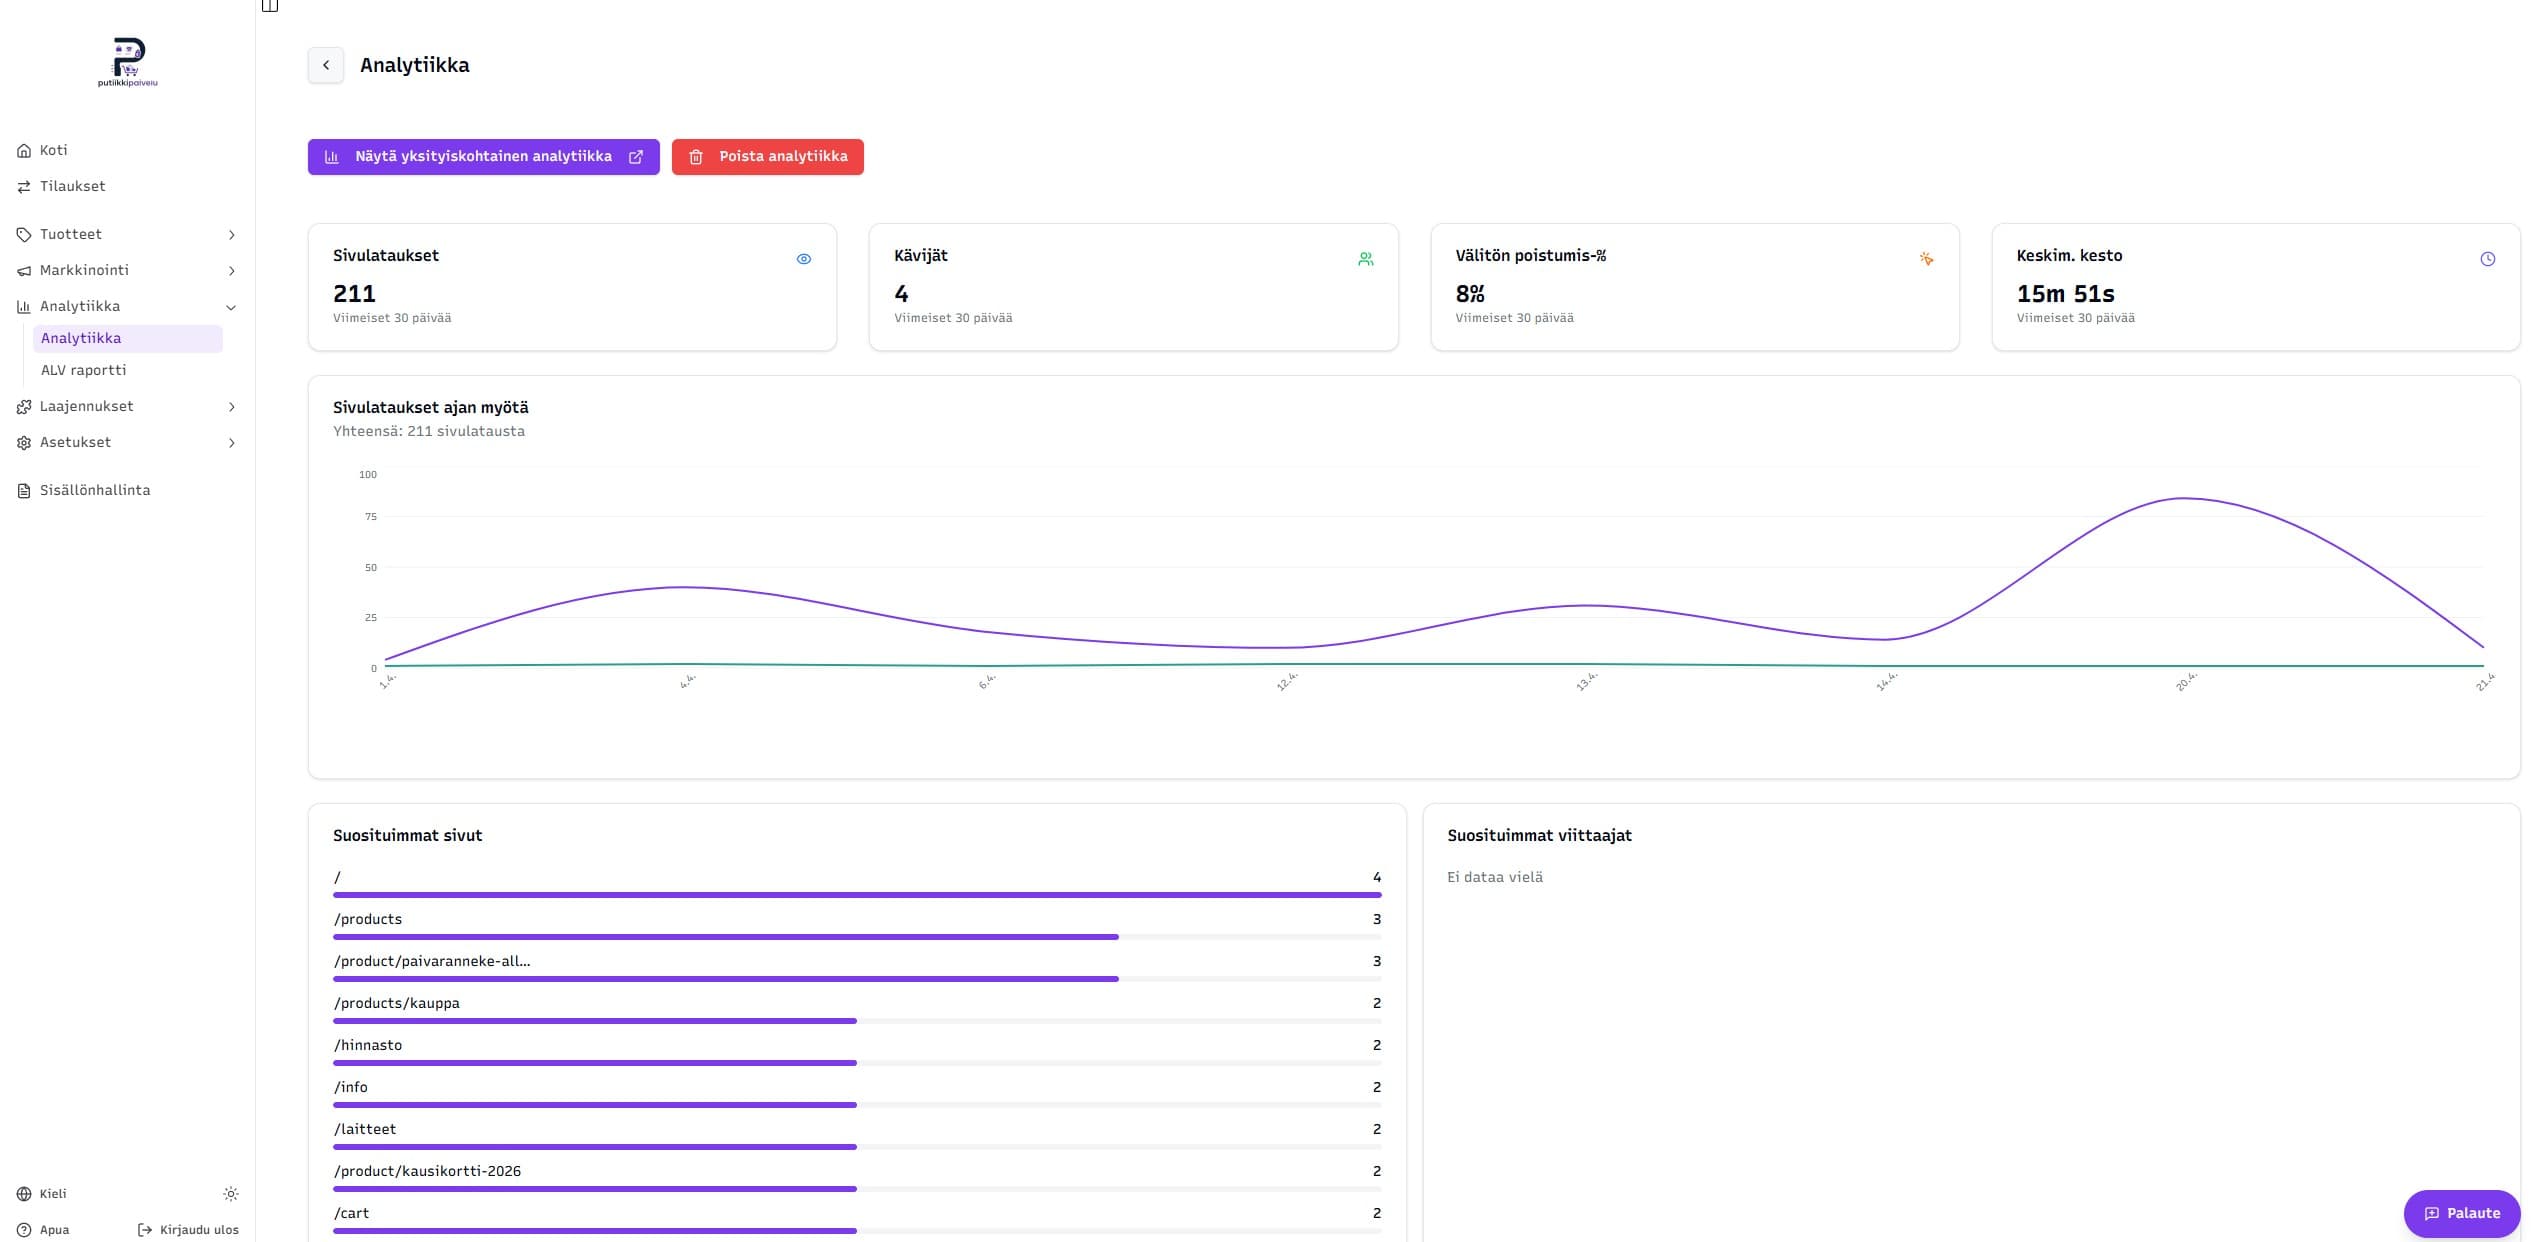
Top row
- Pageviews — how many times your store pages have been loaded
- Visitors — number of unique visitors; if anyone is browsing right now, you'll see "X active now"
- Bounce rate — share of visits where only one page was viewed
- Average duration — how long the typical visit lasted
Pageviews chart
A daily timeline of pageviews and sessions across the 30-day window. The chart makes it easy to see whether a campaign or social-media post moved traffic.
Top pages and traffic sources
- Top pages — most-visited paths in your store
- Top referrers — where visitors came from (Google, social, direct, etc.)
Countries and devices
- Countries — which countries your visitors are browsing from
- Devices — whether your store is used mostly on mobile, desktop or tablet
Detailed view in Umami
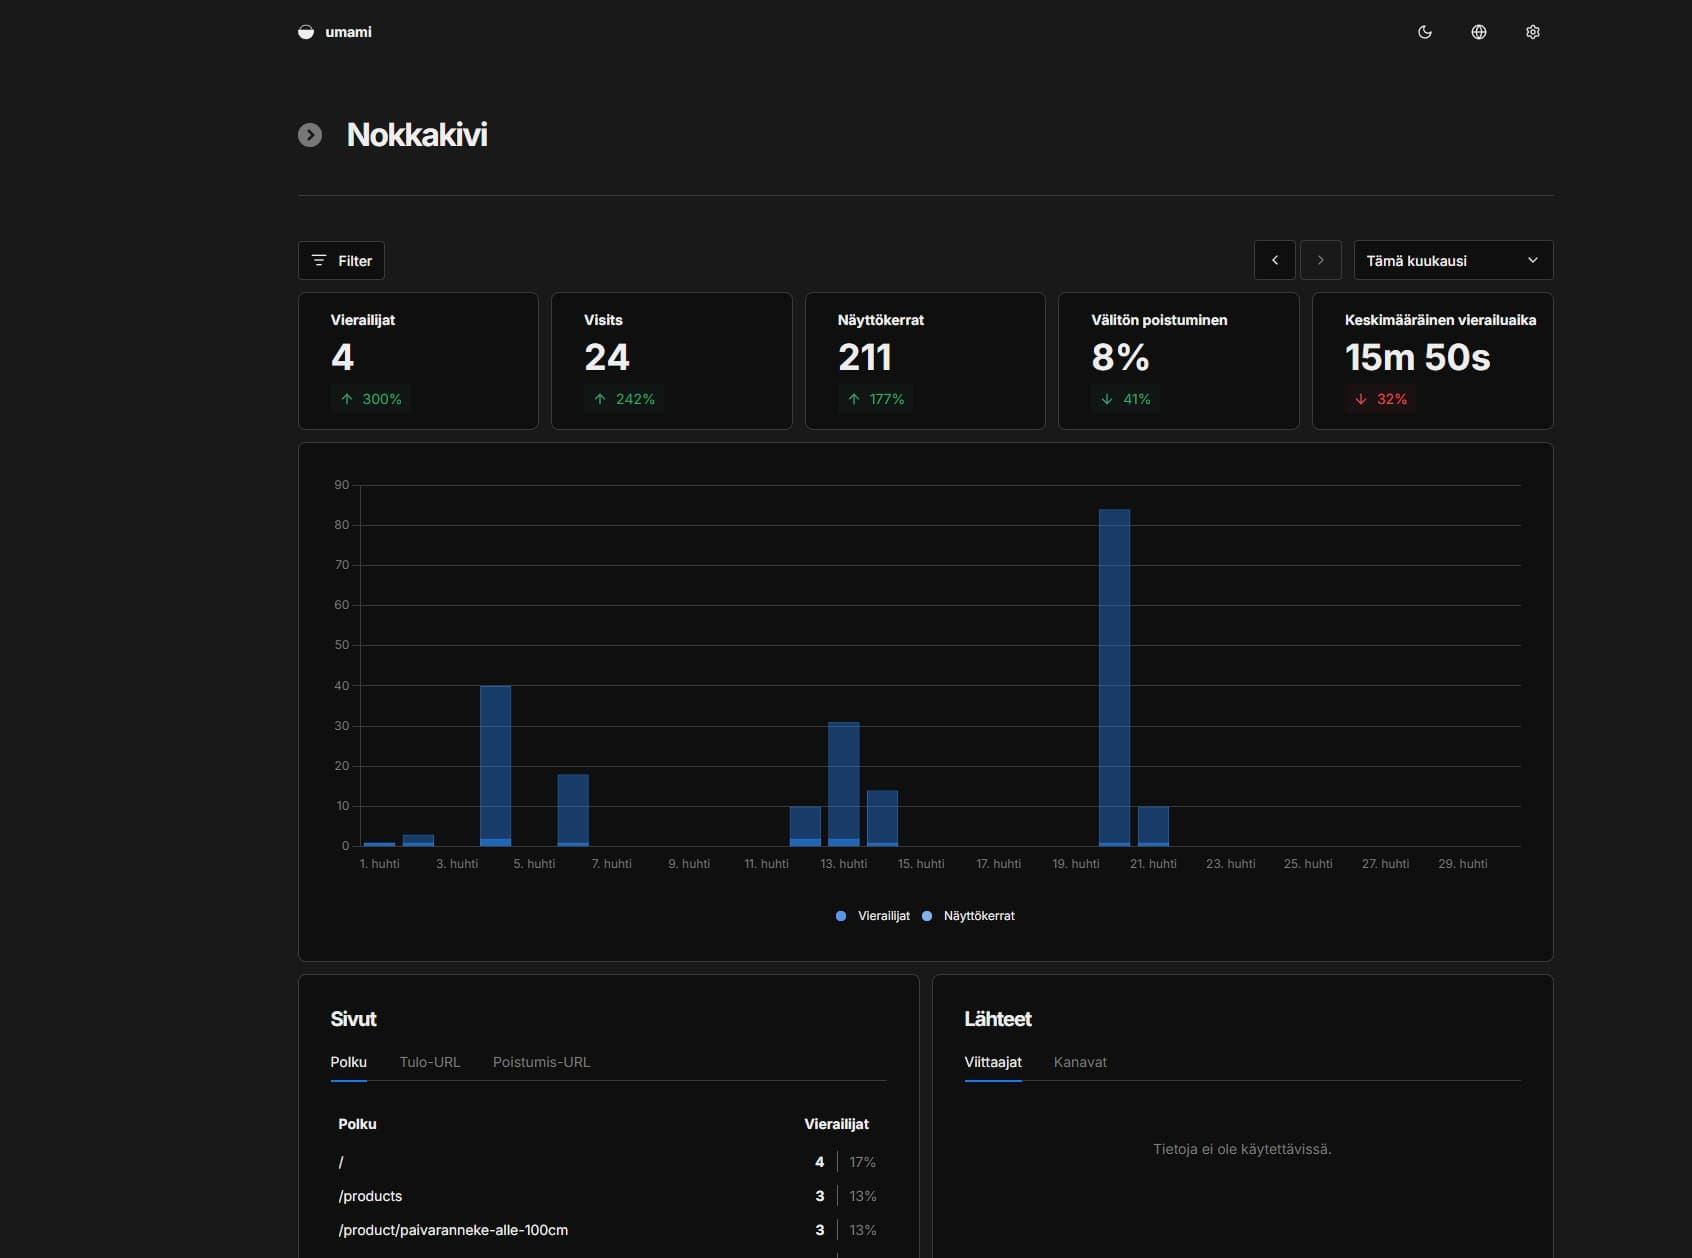
The dashboard summary covers a quick overview, but the full Umami view is a click away on the View detailed analytics button at the top of the page. It opens Umami's own dashboard in a new tab, where you can:
- switch the time range (today, week, month, year, or a custom range)
- compare periods — for example this month against the previous month, with the percentage change shown on each KPI card
- inspect visitor flows from the Pages panel tabs Path, Entry URL and Exit URL
- filter with the Filter button by country, device, traffic source and more
Disconnecting analytics
The Disconnect analytics button stops tracking and removes the dashboard view. Previously collected data is no longer shown. You can reconnect at any time — a fresh tracking period starts from zero.